

Bitcoin is capable of displaying more significant moves in an afternoon than many traditional assets would display in an entire month. This is of great excitement, but it also makes it easy to lose track of which amount one is actually making (or losing). A good Bitcoin ROI calculator somewhere converts price moves into something practical: profit in pounds or dollars, ROI as a percentage, and – if you want it an annualized return that you can compare to other investments.
This guide elucidates what ROI actually measures, as well as how a Bitcoin ROI undergoes the process of calculations, computing the explanation of the results, and the grounding of their full real-world iterations and amendments addicts along other parameters.
What does ROI mean in crypto?
ROI stands for “Return on Investment”. When you put a numerical value on a reference, it means your gain or loss. It’s usually shown as a percentage. The common example, if you have £1,000 and you made £250 after all charges, your ROI is 25%.
The two terms often get mixed a lot:
- Profit is the money amount you made or lost (e.g., “I’m up £250”).
- ROI is the efficiency of that result relative to your starting stake (e.g., “I’m up 25%”).
Both matters – ROI and profits weigh in at desired points on your barometer of successes.
What is a Bitcoin ROI calculator?
A Bitcoin ROI calculator, typically referred to as a profit calculator and ROI calculator, estimates the Bitcoin results based on a few disjointed inputs known about your investment: a number indicating the amount you have put away to the asset in question, the date of acquisition of the asset, and the date of disposition of the bitcoins (in case you ought to sell them). Hence, the calculator quite often has the ability to access historical prices for your designated dates and thus compute gain and ROI%.
A typical design library instructs you to plug in the massive invested amount, then points up buy and sell dates, the difference in price between those points being your ROI%.
The term “bitcoin return calculator” is loosely thrown around. Mostly, the word “return” is excommunicated here in its simplistic form meaning “how much did (or could) my investment change opportunities over time?”
Choosing the right Bitcoin ROI calculator
Not all calculators are created equal. If you’re picking one to have at your disposal daily, find yourself a resource that helps you predict reality rather than be subject to a perfect trading textbook:
- Historical pricing by date (so you can check past entries/exits without hunting for charts).
- Fee inputs (trading fee, spread estimate, and – if relevant deposit/withdrawal fees).
- Support for multiple buys/sells so you can model DCA or partial take-profits.
- Annualised return (CAGR or similar) for comparing different holding periods.
- Scenario testing: the ability to try different exit prices (bear/base/bull) and see how sensitive ROI is.
- Clear assumptions: the tool should make it obvious what price source it uses and whether it assumes a single fill or an average.
If a tool will “predict” future profits by establishing a future price estimation, then this is planning, and the markets owe no one a prediction.
The core maths: profit and ROI in one minute
Even if we go online and use any gadgets or online calculators to compute our profits, we require to have it drilled into our minds how it all works. Until you have declared out the part whereby you are so making the minimum profit it can that what is in large print says that you are losing money, here is a rough idea of what would happen:
- How much BTC did you buy? If you invested £1,000 when Bitcoin was £25,000, you bought 0.04 BTC.
- What is it worth at exit? If you sell at £35,000, proceeds are 0.04 × £35,000 = £1,400.
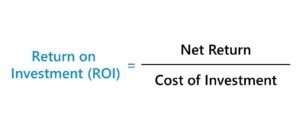
- What’s the net profit and ROI? A standard approach is:
- Net profit = Proceeds − Total cost
- ROI (%) = (Net profit ÷ Total cost) × 100
Here, of course, we consider only the side of net profits that would be £400, and the ROI is 40%, also without accommodating possible charges and fees that should be worked into total costs.
Break-even price: the number that stops you guessing
One of the major premises for using ROI calculators as documents of the past is that they can be used for forecasting, or “what price can I go to and break-even after costs?” In simple terms, let us calculate on a break-even smile:
A simple break-even check:
- Estimate your total entry cost = amount invested + entry fees (and any spread).
- Estimate your total exit costs = selling fees + likely withdrawal/on-ramp costs.
- Work out how much BTC you own (after entry fees), then solve for the sell price where:
Fees reduce the buy and sell prices and, due to the costs incurred, the total price you need to breakeven is higher than your first buy price. But, when you know all that, you can define a more solid target like, maybe, an extra 20% after. Also, you can either depend more on your gut feeling in a winning chance situation.
Common mistakes that skew ROI
Even competent traders mess up over the nitty-gritty sometimes. Primary things to watch include:
- Using a chart price (daily “close”) instead of your real fill.
- Forgetting transfers (network/withdrawal fees).
- Ignoring partial sales (different cost basis for what’s left).
- Leaving out tax assumptions if you’re estimating what you keep.
Annualised return: useful when you’re comparing time horizons
ROI doesn’t tell you how long it took to earn that return. A 40% ROI over six months is not the same as 40% over five years.
To make results comparable, investors often use an annualised figure such as CAGR (compound annual growth rate):
- CAGR = (Ending value ÷ Beginning value)^(1/n) − 1
Where n is the number of years. If £1,000 becomes £1,400 over 2 years, CAGR is about 18% per year.
The real-world drags calculators can miss
Quick calculators often assume you buy and sell at the “headline” price with zero friction. Your actual return can be lower once you add the bits that quietly chip away at performance.
Fees, spreads, and funding costs
- Exchange fees (maker/taker, broker commissions).
- Spread between the price you can buy at and the price you can sell at.
- On-ramp/off-ramp charges (card fees, bank fees, broker mark-ups).
Network fees
If you move BTC on-chain (for example, from an exchange to a wallet, and later back again to sell), network fees reduce your net profit.
Taxes
Rules vary by country, but it’s common for tax to be triggered when you “dispose” of crypto. In the UK, disposing can include selling, swapping for another token, using crypto to pay for goods/services, or gifting it (with certain exceptions).
This isn’t tax advice – just a reminder that “profit” isn’t always profit you keep.
Multiple buys, DCA, and partial sells
Many people build a Bitcoin position over time using dollar-cost averaging (DCA) – investing a fixed amount at regular intervals – rather than trying to time one perfect entry. That reduces timing risk, but it means you no longer have one buy price.
Two practical ways to estimate ROI are:
- Average cost: total spend (incl. fees) ÷ total BTC acquired. For instance, three £100 buys at different prices may produce a blended entry that sits between the highs and lows.
- Transaction-by-transaction tracking: record each buy as its own cost basis (more accurate, especially if you sell in parts).
A more advanced calculator may let you input multiple transactions or upload a CSV so you can see ROI for the whole position rather than a single trade.
When should you take profit?

A calculator can tell you what your ROI is; it cannot tell you what to do. The latter depends on your goals and tolerance to risk. That said, it is helpful to have some rules in place before your emotions take over.
Common strategies here might be as follows:
- Target exits: take some profits at +25%, +50%, +100%, etc.
- Laddering out: sale in pieces, hitting different price targets
- Re-balance: cut Bitcoin anytime its portfolio share gains over the desired percentage.
Whatever you decide to do, pen it down and come up for periodic reviews.
What moves Bitcoin’s price?
Price moves around and ROI sways on account of such movements. Prices are pretty sensitive to a number of factors in this universe. Normally, cryptocurrencies are sensitive to the demand and supply, acceptance, regulations, and the ebb and flow of news.
For traders in Bitcoin, they would also be watching liquidity conditions, significant secondary market inflows or outflows, or major events pertaining to protocol or infrastructure. There is no single factor that explains all moves, so view ROI outputs as “If this happens, then…” rather than their certainty.
Final thoughts
A Bitcoin ROI сalculator is an easy way to make some sense out of a noisy market; it takes each moment of price action and converts it into profit, ROI% and in some cases, annualized return rate. A Bitcoin return calculator allows you to compare strategies, such as lump sum buy versus DCA. And from there, you’ll need to figure out what is “good enough” for you while including the impact of frictions, or in other words, what you get out of it in real life.
FAQ
Are “Bitcoin ROI calculator” and “bitcoin return calculator” the same thing?
Mostly, yes. Both calculate profit or loss and ROI% based on entry and exit price most commonly. Some instruments also “return” it because of an annualized metric (CAGR). But at heart, it’s the same thing.
What’s the difference between ROI and annualised return?
ROI gives the total percentage gain/loss over the entirety of your holding period. Converting that result into a per-year factor makes it easier to compare trades or investments held for different times.
Can an ROI calculator predict future profits?
No, it is not designed to definitively predict anything. It can attempt “what if” scenarios using a hypothetical future price, but it cannot predict market direction. Think of using one for planning out the targets, finally one for break-even levels-size and another set for ‘easy to implement’ risk checks.