
This guide takes a useful approach to Floki price prediction. Instead of treating forecasts like guarantees, we’ll compare published prediction ranges, explain what those targets actually imply (especially in market-cap terms, given FLOKI’s large supply), and break the 2026–2030 outlook into realistic scenarios. You’ll get a clearer view of what could push FLOKI higher, what could hold it back, and how to read long-term projections without getting trapped by optimism.
FLOKI price at a glance in January 2026
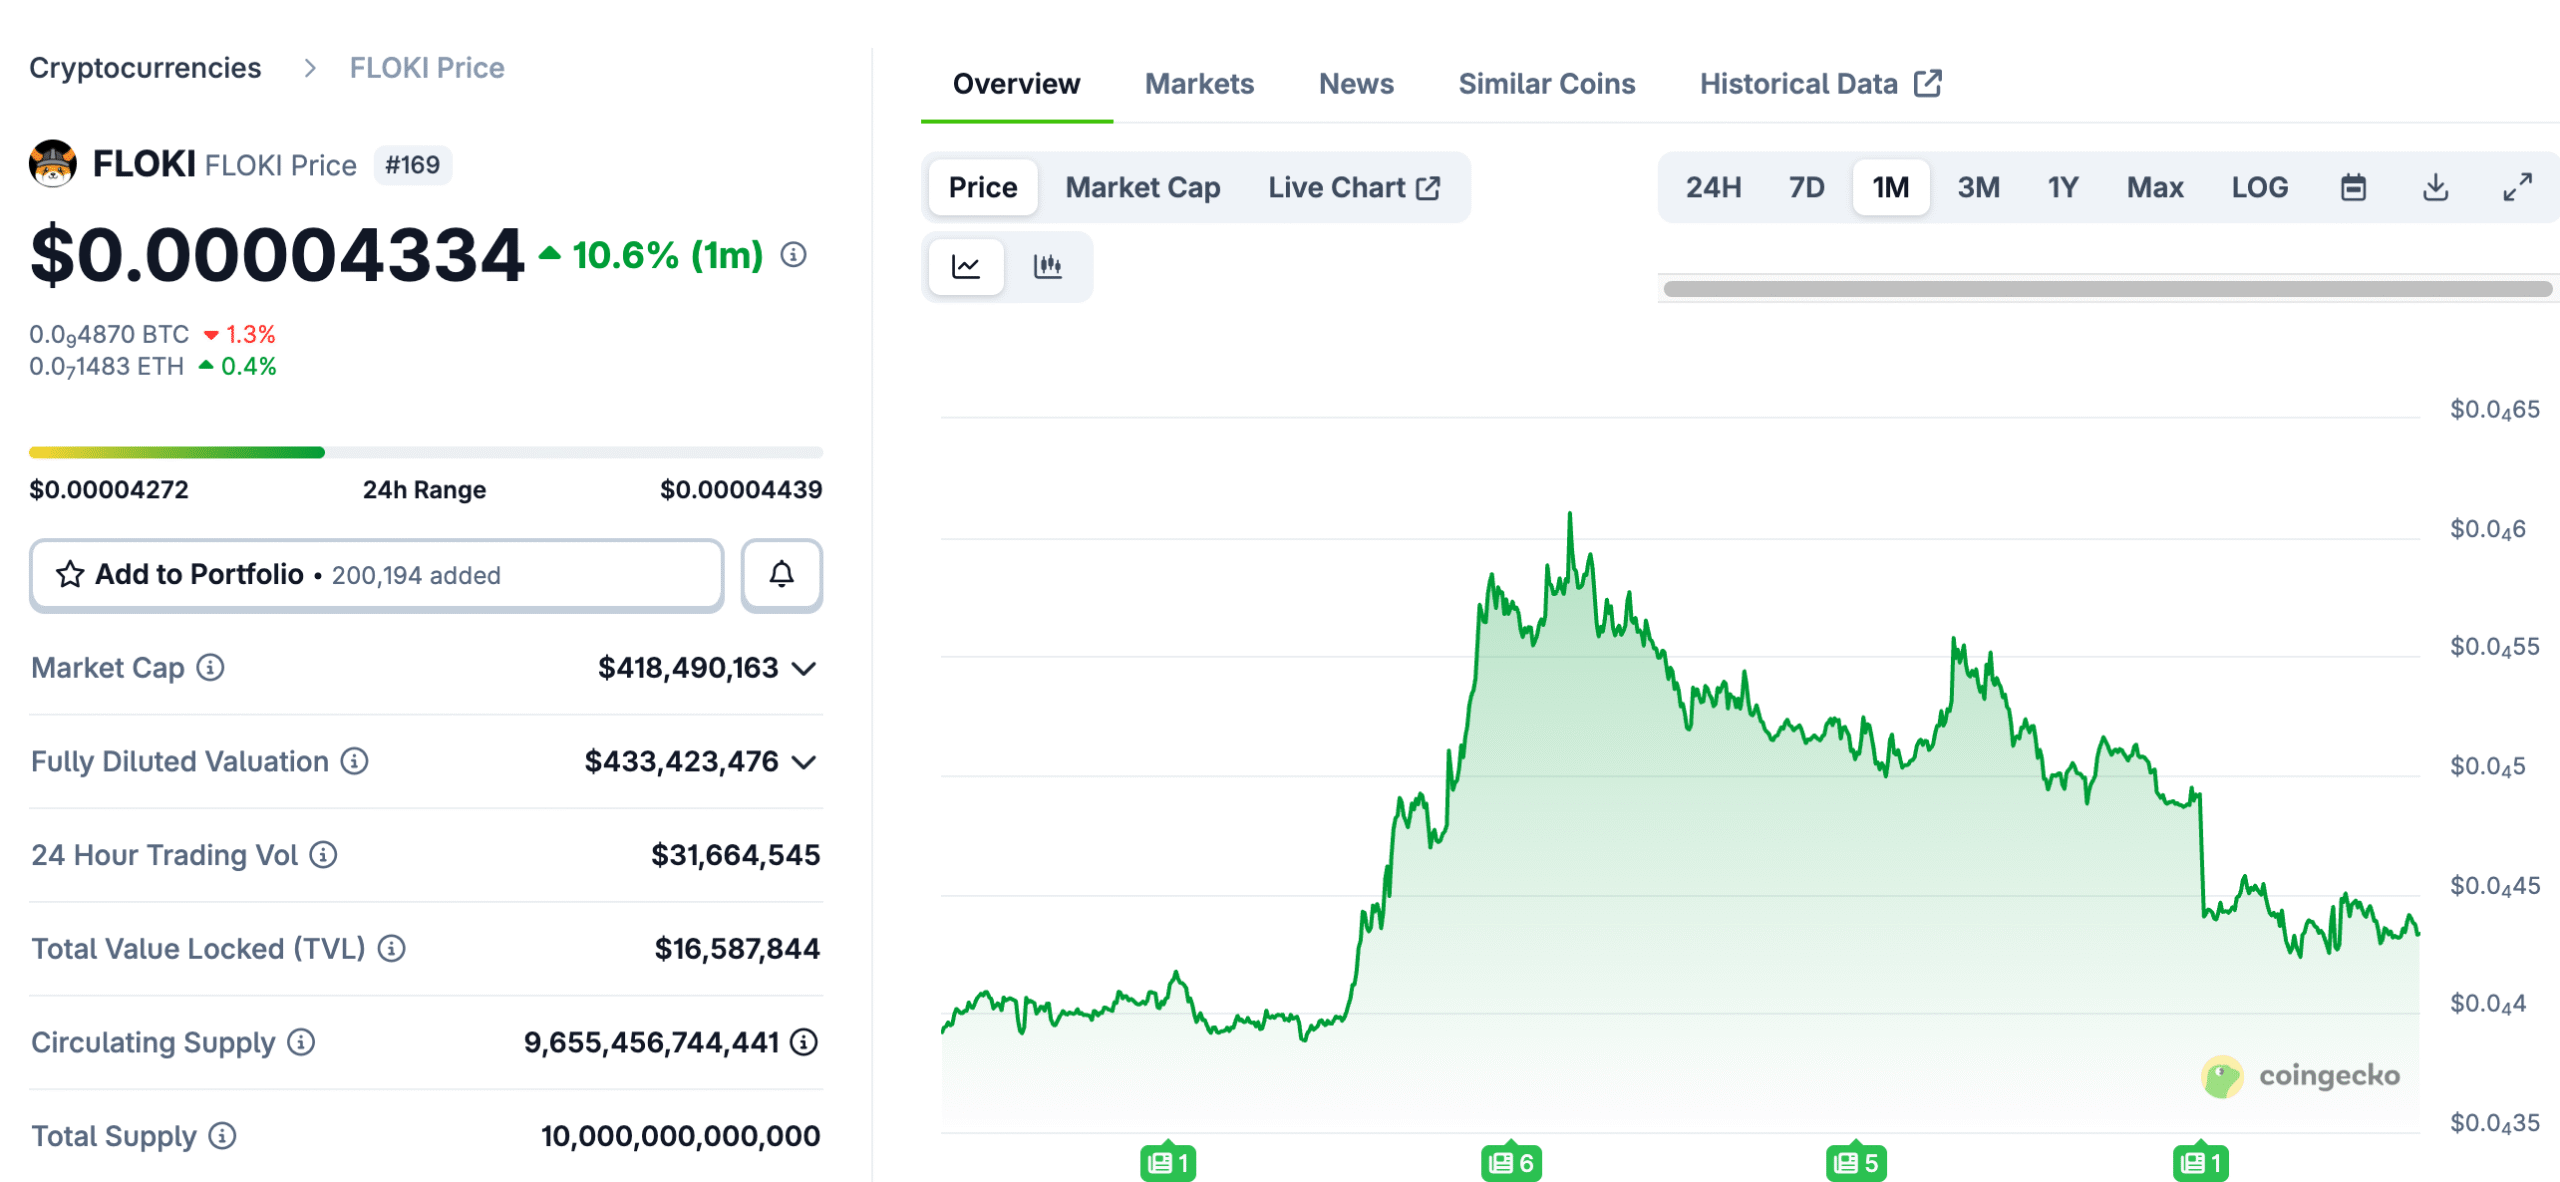
Source: Coingecko
Let’s anchor the current data:
- FLOKI price today: roughly $0.000044 (varies slightly by venue).
- Circulating supply: about 9.54 trillion FLOKI (give or take as trackers update).
- Project positioning: Floki markets itself around community, utility, and charity, and highlights products like a metaverse game (Valhalla) and DeFi tooling (FlokiFi).
Those bullets matter because the long-term “floki crypto prediction” story is basically a tug-of-war between meme attention and product traction—with token supply quietly doing the heavy lifting behind the scenes.
What actually moves FLOKI’s price long term?
Here are the drivers that typically decide whether FLOKI gets a “trend year” or a “ghost year.”
Utility that creates repeat demand
Floki’s pitch is that it’s not “just a meme.” On its official site, it frames the ecosystem as utility-forward (metaverse, DeFi, education, merch).
Its timeline also highlights FlokiFi Locker as a product launch tied to utility and token burn mechanics.
If products actually get sticky usage (wallets, lockers, in-game economies), they can add a second demand engine beyond social buzz.
Tokenomics and supply math
With ~9.54T tokens circulating, small-looking decimals add up fast:
- At $0.000044, FLOKI’s implied market cap is around $420M (ballpark, depending on supply and price).
- At $0.000318 (one published 2030 average forecast you’ll see below), implied market cap is roughly $3.0B—a big jump, but not fantasy-land.
- At $0.00263 (a much more aggressive “2030 high” seen in some commentary), implied market cap is ~$25B, which would require sustained, global-scale demand—possible in a full mania, hard in a quiet cycle.
This is why “floki price” targets need to be read alongside market-cap expectations.
Regulation and access in major markets
One of the more concrete developments around FLOKI’s legitimacy narrative is the MiCAR white paper route via LCX. LCX explains that under the EU’s Markets in Crypto-Assets Regulation (MiCA/MiCAR), assets admitted to trading require a compliant white paper and a registration/notification pathway involving national competent authorities and ESMA’s register.
This doesn’t guarantee price appreciation, but it can influence who can list/trade an asset in regulated environments.
Macro cycles: memecoin seasons still matter
Even “utility memecoins” tend to move hardest when liquidity floods the market. Any floki inu price prediction is, implicitly, a bet on whether 2026–2030 contains one or more strong risk-on phases.
How to read FLOKI price forecasts correctly
Before we get to numbers, one important reality check: forecasts are not facts. They’re typically produced from some mix of technical indicators, historical volatility, and “if adoption grows” narratives.
So instead of treating forecasts as destinations, use them as ranges to stress-test your own assumptions:
- What happens if meme liquidity dries up for 18 months?
- What happens if exchanges tighten listing standards?
- What happens if a new product release actually sticks?
FLOKI price prediction for 2026–2030
Below is a comparison of two widely-circulated, model-driven forecast sources:
| Year | Changelly (Min / Avg / Max) | DigitalCoinPrice (Range or Level) |
| 2026 | 0.00006313 / 0.00006538 / 0.00007497 | 2026 monthly table ranges roughly 0.00000892 → 0.0000430 |
| 2027 | 0.00009331 / 0.00009592 / 0.0001096 | 0.00000570 → 0.0000179, “most likely” ~0.0000100 |
| 2028 | 0.0001415 / 0.0001463 / 0.0001625 | starts ~0.00000694, “trade around” ~0.0000571 |
| 2029 | 0.0002109 / 0.0002167 / 0.0002468 | possible ATH zone 0.0000419 or 0.0000902 |
| 2030 | 0.0003071 / 0.000318 / 0.0003644 | 0.0000926 → 0.000189 |
Why the forecasts diverge so much
The spread isn’t a rounding error—it’s a methodology mismatch:
- Changelly’s curve trends steadily upward into 2030.
- DigitalCoinPrice’s path is far more jagged, showing deep 2026 weakness in its month table and comparatively lower long-range targets.
That’s why a smart reader treats this as scenario space, not prophecy.
Scenario-based outlook for 2026–2030
Instead of one “official” number, here are three scenarios that help translate forecasts into decision-making.
Bear case: meme liquidity cools, utility adoption is slow
In this world, FLOKI trades like many memecoins do after a hype cycle: long, choppy downtrends punctuated by short squeezes. DigitalCoinPrice’s weaker ranges resemble this vibe, especially its 2026 month table.
Base case: FLOKI survives, product updates, rotations
This is the “doesn’t die, doesn’t moon nonstop” path. The price may revisit prior zones during broad crypto risk-on periods, while utility provides some floor.
Bull case: sustained memecoin supercycle + utility narrative
For a true bull case, FLOKI needs both:
- mass retail attention, and
- credible reasons to keep holding/using beyond the meme.
That’s where things like the ecosystem narrative (community/utility/charity) and product surface area matter.
Practical sanity checks
1) Translate price into market cap
Because supply is huge, always do the mental conversion. With ~9.54T in circulation, every extra $0.0001 adds roughly $954M in market cap.
2) Separate trading from investing
If your plan is to swap crypto during volatility, you care about liquidity, spreads, and timing more than 2030 forecasts. If your plan is long-term conviction, you care about product adoption and regulatory access.
3) Watch “access” catalysts
MiCA/MiCAR compliance talk won’t magically pump price—but market access can matter over time. LCX explains the admission-to-trading concept and the role of MiCAR white papers in EU trading eligibility.
How and where to exchange FLOKI responsibly
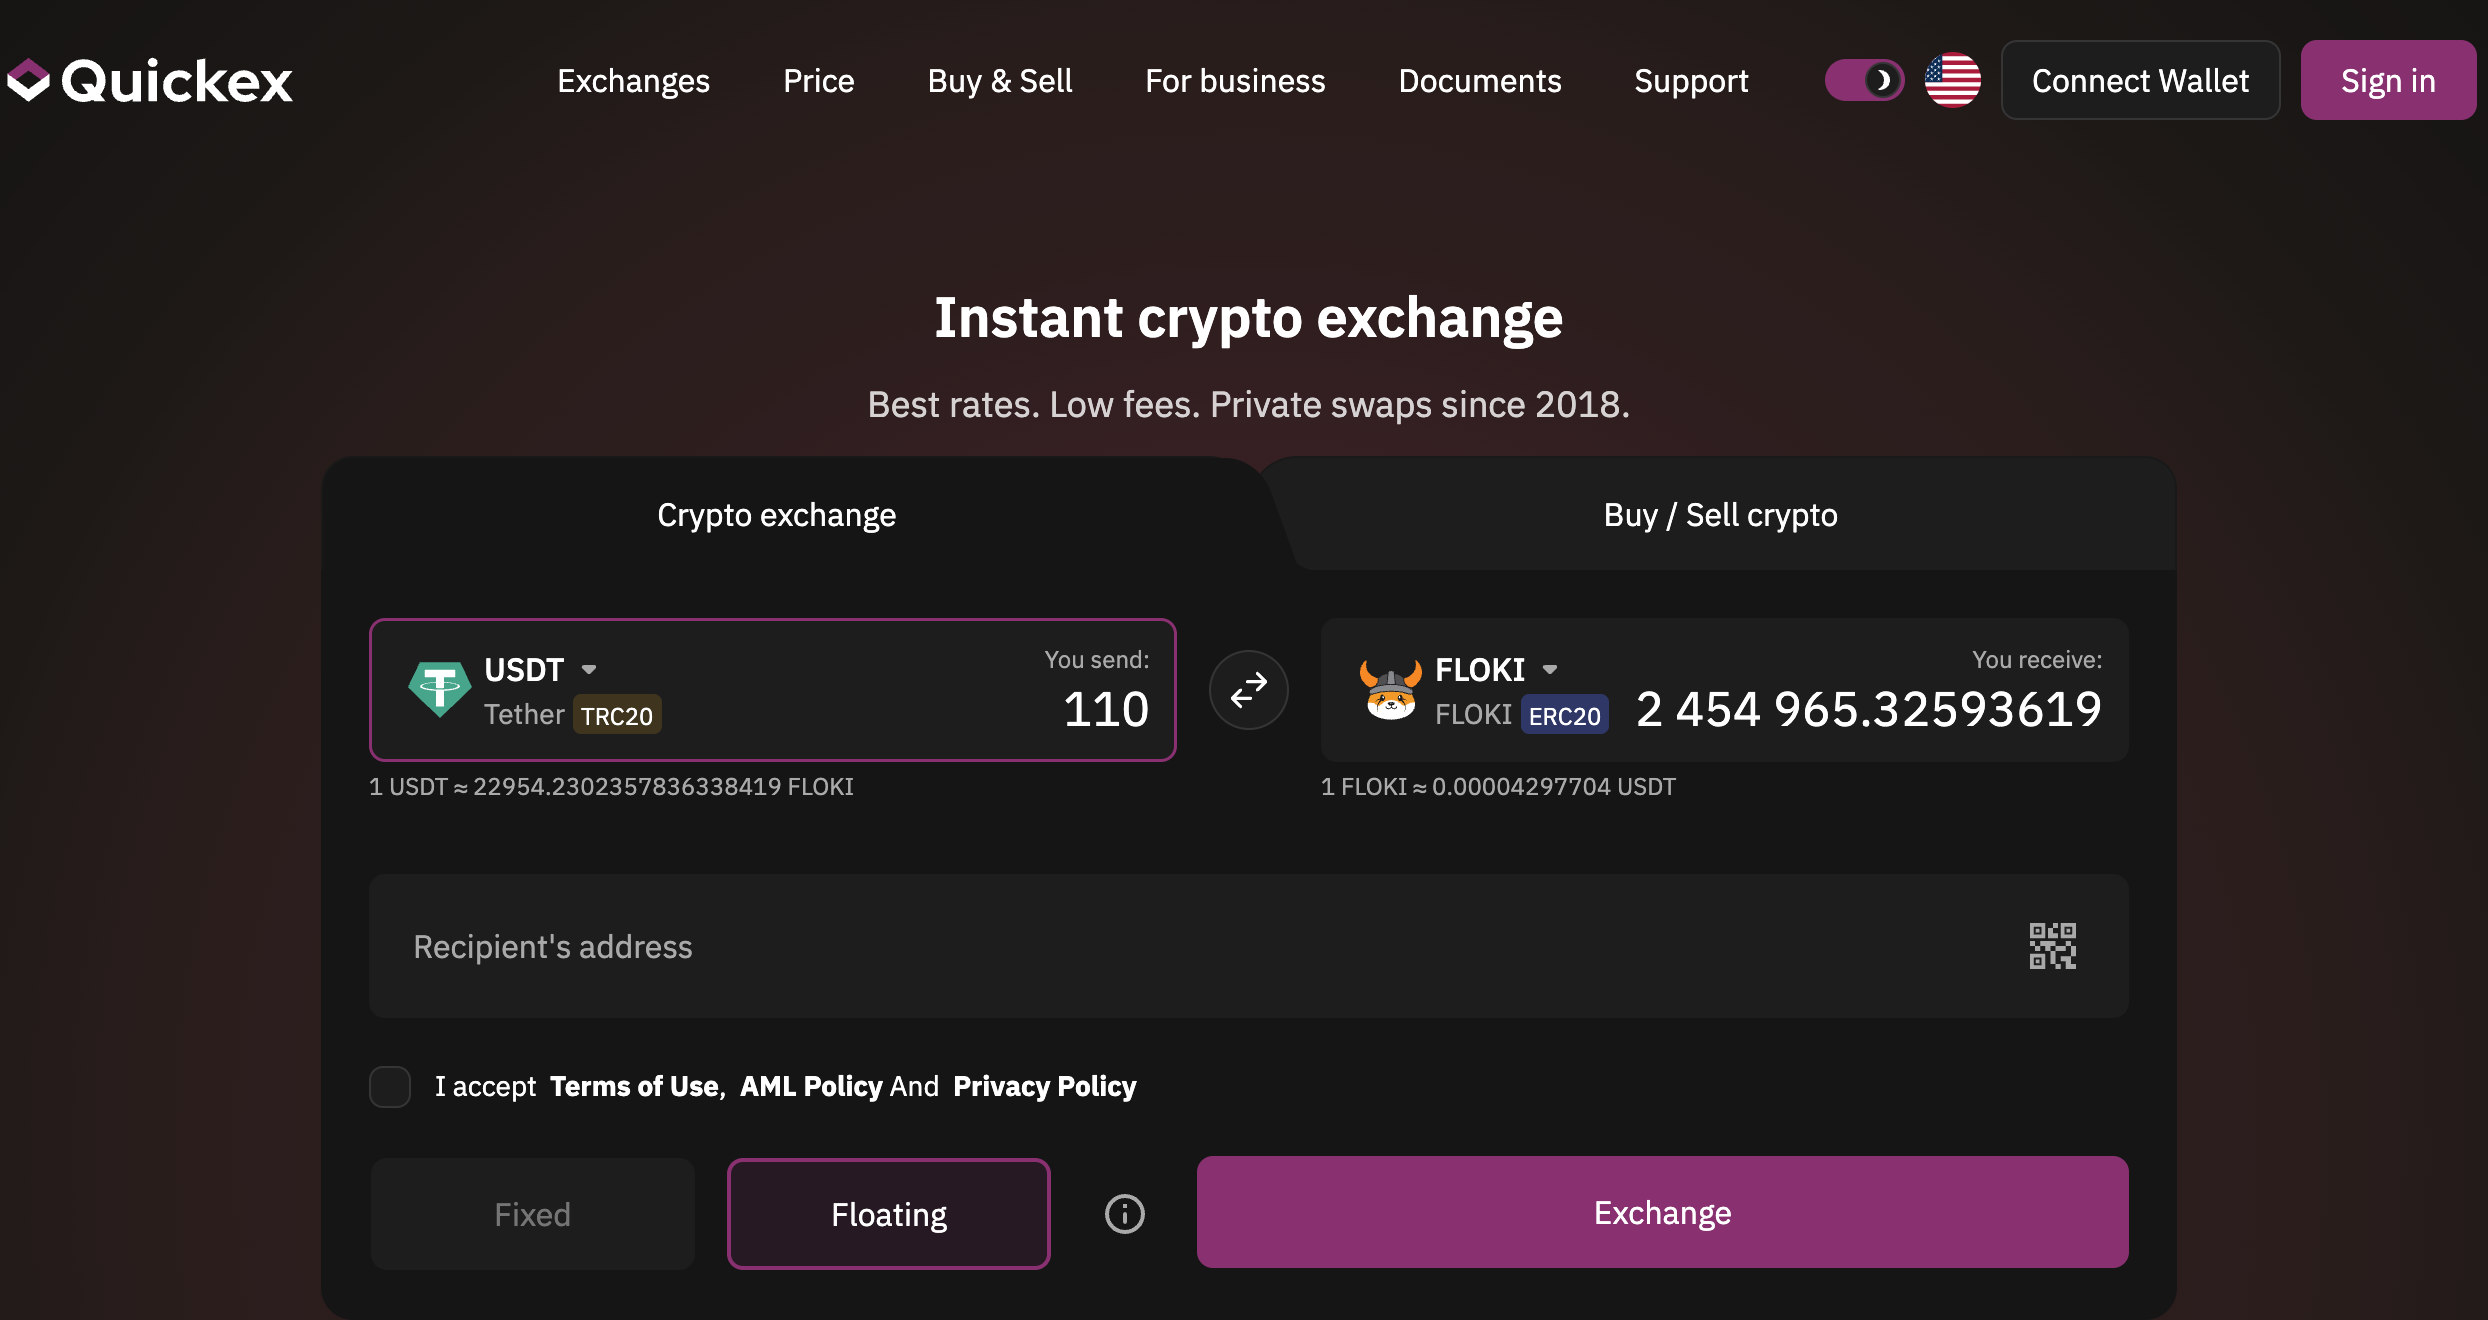
If you’re actively trading, keep it simple:
- Decide whether you’re doing a spot hold or a shorter-term trade.
- If you want to take risk off, many traders rotate into stablecoins or Solana—yes, sometimes literally FLOKI to SOL (to lock gains or wait for a better entry).
- If you’re moving between majors and memes, it’s common to exchange Bitcoin into USDT on Quickex during rotation phases, then de-risk back when momentum fades.
What to believe about FLOKI through 2030?
The most honest summary is this: FLOKI can absolutely move hard, but the path depends on whether it remains a top-tier memecoin narrative and whether its “utility” story continues to mature beyond marketing.
Published forecasts for 2026–2030 range from conservative to optimistic, and they disagree sharply—so the best use of a floki inu price prediction isn’t “pick the highest number,” it’s “understand what has to be true for that number to make sense.”
FAQ
What is the most realistic floki price prediction for 2026?
Forecasts vary widely. Changelly’s 2026 range sits around 0.000063–0.000075, while DigitalCoinPrice’s 2026 month table shows much lower levels down to ~0.00000892.
Does floki inu price prediction 2026 depend more on hype or fundamentals?
In practice: both. Meme liquidity drives bursts, but longer staying power is helped if the ecosystem products keep users engaged.
What about floki inu price prediction 2030—can it really be that high?
Some forecasts place 2030 averages around 0.000318 (Changelly), while others cap 2030 below 0.000189 (DigitalCoinPrice). Whether higher targets are plausible depends on market-wide liquidity and FLOKI’s ability to sustain demand at scale.
Where can I track floki price today reliably?
CoinGecko and CoinMarketCap are common reference points for live price, volume, and circulating supply data.