
A serious Polkadot price prediction in 2026 has to start with one uncomfortable truth: most older DOT articles are already outdated. They still talk about parachain auctions as if Polkadot were frozen in 2023. In reality, Polkadot’s story has shifted toward Agile Coretime, Asynchronous Backing, Elastic Scaling, Asset Hub, OpenGov, and the long-term JAM roadmap. On top of that, March 2026 brings a major tokenomics reset: a 2.1 billion DOT cap, a 53.6% cut in early emissions, and the rollout of the Dynamic Allocation Pool, or DAP.
That is why this article treats DOT less like a simple Layer-1 coin and more like a changing economic system. In March 2026, Polkadot trades around $1.51, with a market cap near $2.52 billion, 24-hour volume around $258.5 million, and a circulating supply of about 1.67 billion DOT. CoinMarketCap also lists a max supply of 2.1 billion DOT, reflecting the new capped-supply framework.
If you are searching for DOT price prediction, Polkadot prediction, Polkadot crypto price prediction, or a realistic Polkadot forecast, the right question is no longer “Will auctions come back?” It is “Can Polkadot’s 2.0 architecture finally translate technical strength into sustained DOT demand?” That is the core of the 2026–2035 thesis.
Polkadot Market Analysis: March 2026 Pulse Check
Current DOT Performance: Navigating the Post-Halving Market
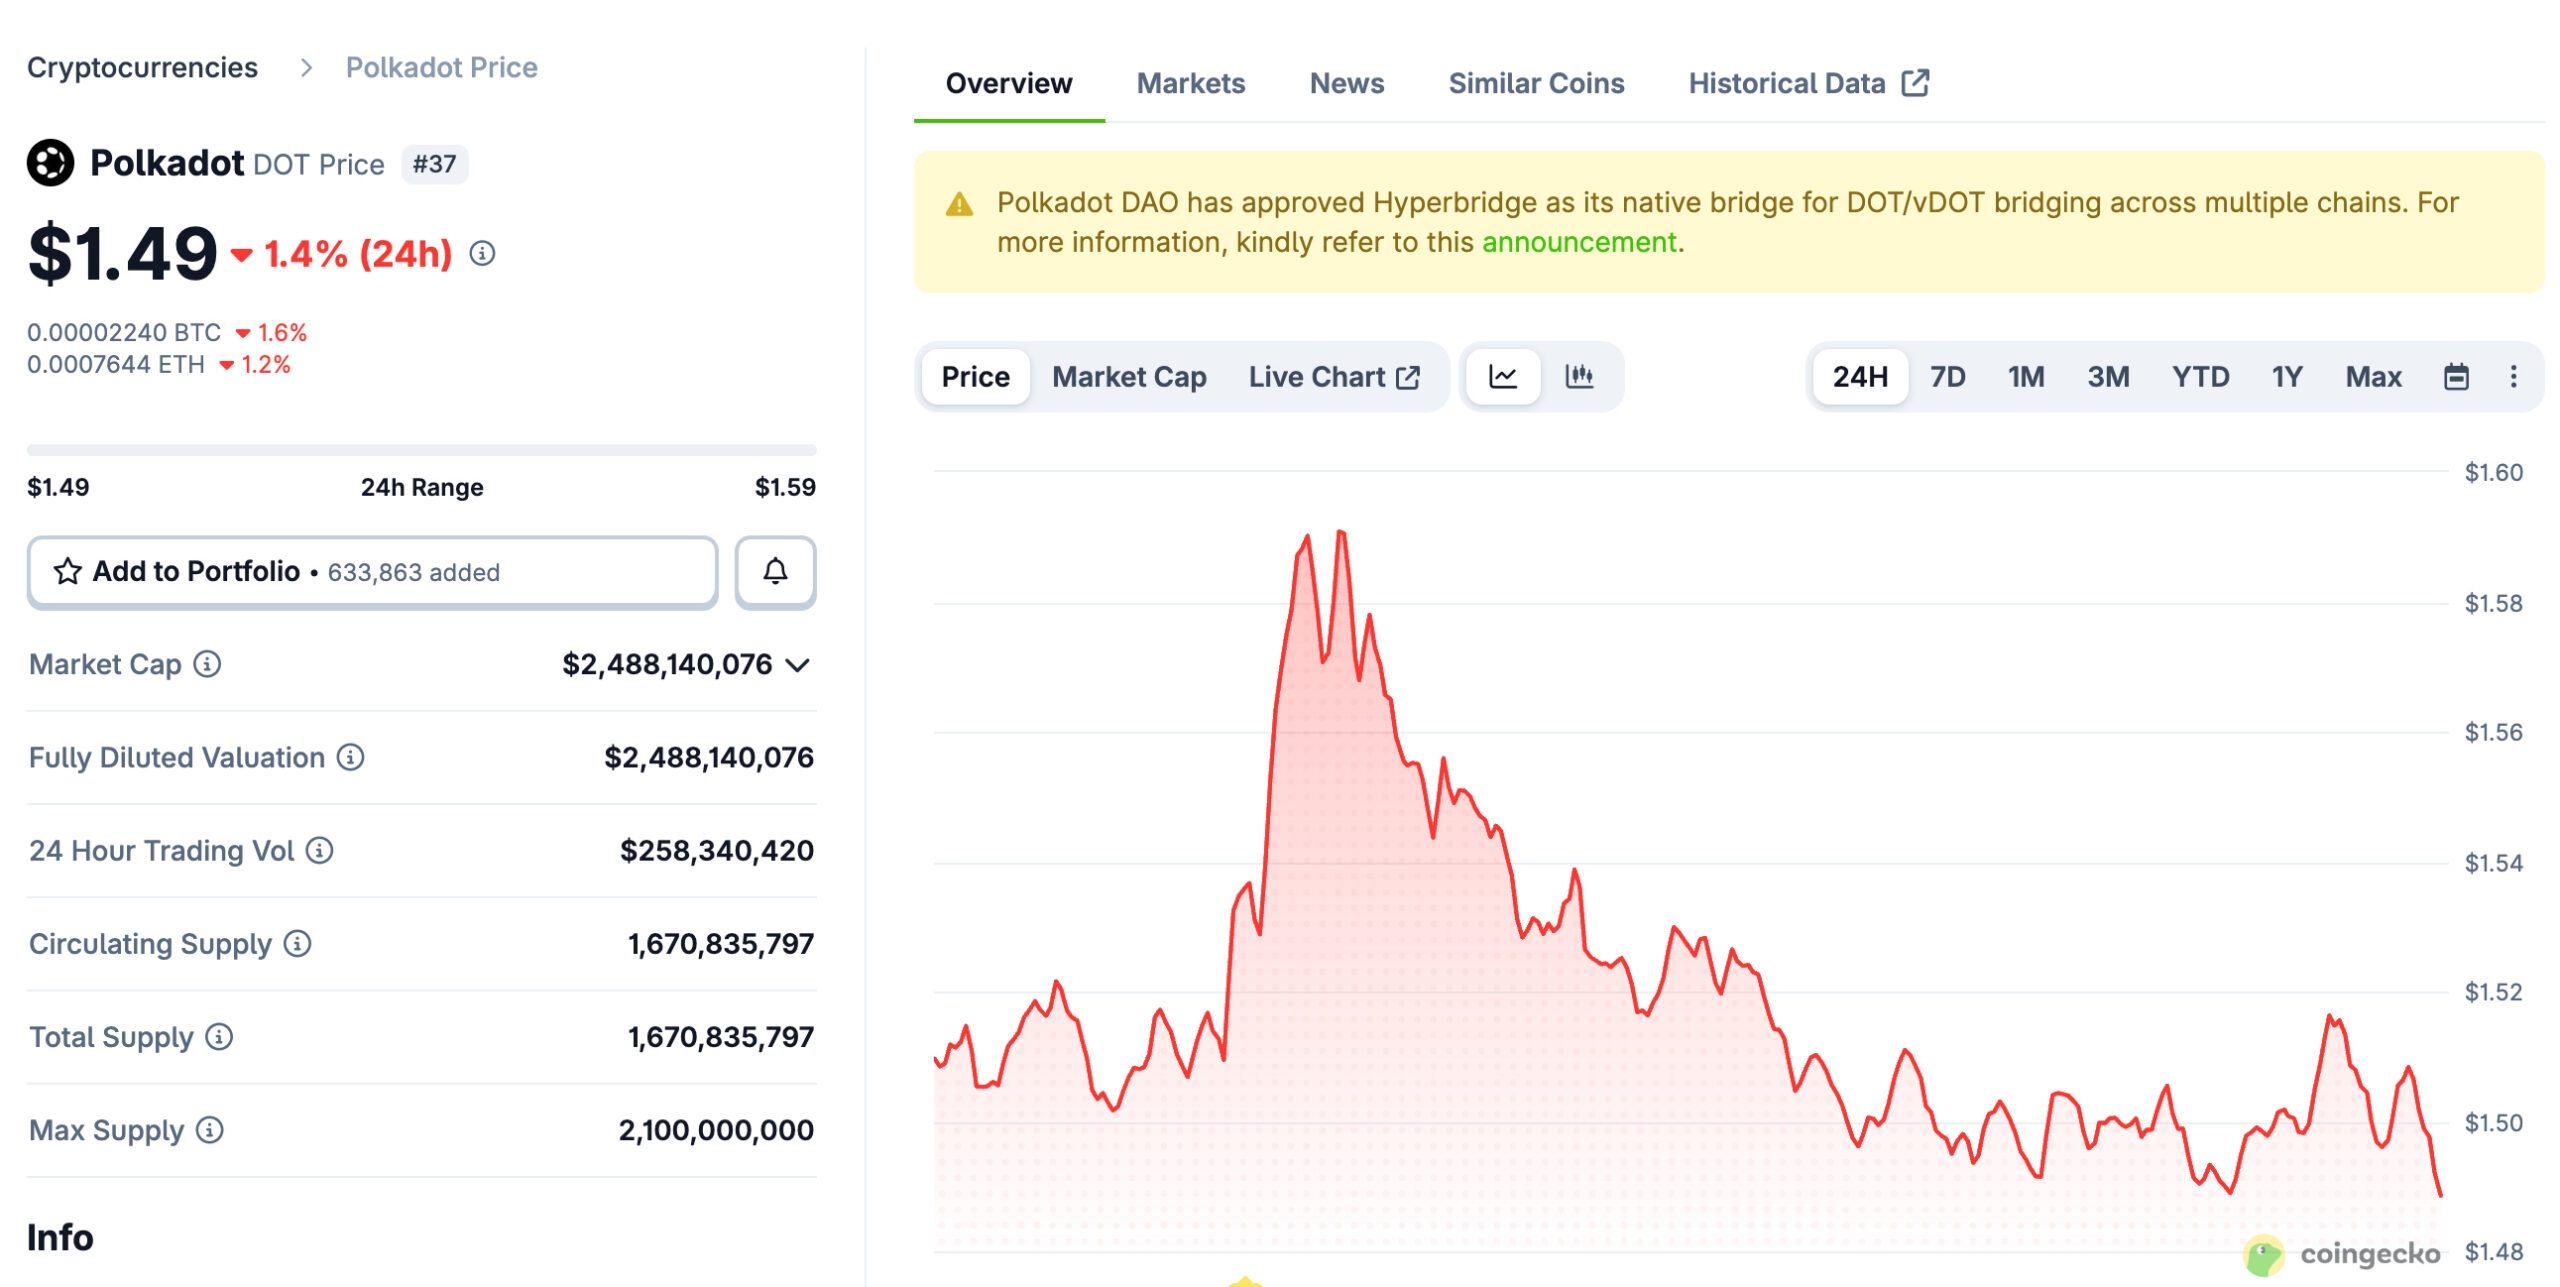
Source: Coingecko
DOT enters March 2026 in a strange position. On one hand, price is still heavily depressed versus previous cycle highs. CoinGecko’s market data shows Polkadot’s all-time high at $54.98, which means current pricing is still deeply below peak-cycle enthusiasm. On the other hand, DOT is no longer being repriced as a simple “auction coin.” The market is now digesting a supply reset, a staking redesign, and a broader shift toward blockspace markets and app-centric infrastructure.
That is why the current DOT weakness can be read in two ways. Bears see a former top-10 asset that never regained narrative momentum. Bulls see a deeply repriced network entering its first genuinely different economic regime. In March 2026, both views were defensible.
From Parachains to Coretime: Summarizing the Polkadot 2.0 Transition
Polkadot 2.0 is really about replacing a rigid resource model with a market-driven one. Agile Coretime is the scheduling framework that lets parachains buy compute either continuously through bulk coretime or flexibly through on-demand coretime. The official docs describe this as Polkadot’s move toward adaptable blockspace production rather than long, inflexible slot assignments.
That matters for any modern Polkadot coin price prediction because the old auction model created high barriers to entry. Teams had to lock large amounts of capital and plan years ahead. Coretime changes that. Builders can now buy blockspace in shorter, more practical increments, which makes Polkadot cheaper and more flexible for gaming, payments, rollups, and enterprise-style workloads.
Staking Statistics: Current Yields and Total Value Locked (TVL)
Polkadot still has a heavily staked supply base. Polkadot’s own platform materials show a staking rate around 51%, while third-party staking analytics place the staking ratio closer to 52.86% and nominal reward rates around 11.5%. Meanwhile, DeFiLlama shows Polkadot with roughly $98.23 million in stablecoins on-chain and a token market cap around $2.53 billion.
That combination is important. DOT is not a dead asset with no committed capital. But it is also not a thriving DeFi giant. The network still has enough economic activity to matter, yet not enough to win on momentum alone. That is exactly why 2026 is a transition year.
The Polkadot 2.0 Fundamentals
Agile Coretime: Moving Beyond the “Lease” Model to On-Demand Security
Agile Coretime is the most important architectural change most legacy DOT articles still under-explain. Under the old model, projects effectively rented parachain slots through long-duration leases. Under the new model, they can buy core access via bulk coretime for continuity or on-demand coretime for pay-as-you-go usage. The official docs explicitly frame this as efficient scheduling of Polkadot cores and access to blockspace based on real needs rather than fixed long-term commitments.
Here is the practical comparison:
| Feature | Parachain Leases | Agile Coretime |
| Access model | Long-term slot lease / auction era | Bulk + on-demand scheduling |
| Capital burden | High upfront commitment | Lower, usage-based flexibility |
| Best for | Long-horizon chains with stable demand | Startups, gaming, volatile workloads |
| Scaling model | One slot, one chain mindset | Dynamic access to one or more cores |
| Market efficiency | Lower | Higher |
This table is based on Polkadot’s current docs and migration guides, which now describe coretime as the modern route for block production.
For a DOT coin price prediction, the bullish angle is obvious: if more builders can afford Polkadot security, more demand can flow into the network. The bearish angle is also obvious: flexibility helps, but only if developers actually show up.
Asynchronous Backing: How Polkadot Increased Throughput by 8x
Asynchronous Backing is one of the least flashy and most important upgrades. According to the Polkadot Wiki, because throughput doubles and parachains get four times more execution time, asynchronous backing is expected to deliver 8x more blockspace to parachains. Parity’s 2025 upgrade recap also treats Asynchronous Backing as one of the three pillars that redefined Polkadot’s performance model.
In plain English, this means Polkadot became less bottlenecked. Instead of squeezing every chain through the same narrow validation rhythm, asynchronous backing gives more room for actual application execution. That is particularly relevant for high-frequency use cases such as gaming, real-time marketplaces, and data-heavy services.
Elastic Scaling: Meeting the Needs of Web3 Gaming and Enterprise Apps
Elastic Scaling builds on Coretime by letting parachains use multiple cores simultaneously. The official docs say it breaks the old 1:1 relationship between a parachain and one relay-chain block, allowing multiple blocks to be processed in parallel and making throughput more responsive to demand. The docs also explicitly call out gaming, payment processors, trading systems, and IoT as target use cases.
This is where the technology starts to look less theoretical. If a game or real-time financial app suddenly gets traffic spikes, the old slot model was a poor fit. Elastic Scaling is Polkadot’s answer to bursty demand. In other words, it turns shared security into something closer to cloud infrastructure.
Polkadot Price Prediction 2026: Recovery or Consolidation?
Q2–Q4 2026 DOT Forecast: The Impact of “Coretime Burning”
This is the section where old and new Polkadot narratives collide.
Older Polkadot 2.0 materials and the Polkadot Wiki describe coretime sales as burned, which is why many investors began modeling DOT as a potentially deflationary asset. The Polkadot Wiki still phrases burned supply as including treasury burns and coretime sale burns. But the fresh March 2026 economic overhaul changes the picture: Parity’s latest announcement says treasury burns stop, and transaction fees, coretime sales, and slashes are redirected into the Dynamic Allocation Pool (DAP) instead. At the same time, annual issuance drops sharply and then steps down every two years.
So the most accurate 2026 takeaway is this:
Polkadot’s “deflation thesis” has evolved. It is no longer just “coretime burns DOT.” It is “issuance is being cut hard, supply is capped, and protocol revenues are being routed into a governance-controlled issuance buffer instead of the old treasury-burn system.” That still improves scarcity dynamics relative to the old regime, but it is more nuanced than legacy articles suggest.
Technical Analysis: Identifying the Support and the Breakout Target
Here is the honest part: in March 2026, $5.50 is not current support. DOT is trading around $1.5, so calling $5.50 a live support level would be inaccurate. Instead, I would treat $5.50 as a major reclaim zone and $12 as a true narrative breakout target if the market regains confidence in Polkadot 2.0.
That leaves the actual technical map looking more like this:
- Near-term floor: roughly $1.20–$1.50
- First recovery band: $2.50–$3.50
- Major reclaim zone: $5.50
- Bull-market narrative breakout: $12.00
So if you are looking for a grounded DOT price prediction 2030 or a shorter-term DOT crypto price prediction, the real question is whether DOT can first escape the low-single-digit trap before anyone seriously talks about double digits.
Ecosystem Growth: How JAM is Changing the Narrative
JAM, or the Join-Accumulate Machine, is Polkadot’s long-term successor vision for the Relay Chain. Official Polkadot docs describe it as a transformative redesign of core architecture, while the Web3 Foundation’s JAM site says it is a new protocol designed to succeed the relay chain and provide significantly enhanced smart-contract functionality.
Why does that matter to price in 2026, even before full deployment? Because JAM changes how investors think about Polkadot’s ceiling. Instead of remaining “the parachain network,” Polkadot starts looking more like a generalized decentralized compute system with Polkadot-style parallelism and Ethereum-like programmability. That is a bigger story than parachain leasing ever was. It also makes Polkadot price prediction 2030 and Polkadot price prediction 2040 models much more sensitive to execution success.
Polkadot Price Prediction 2027–2029
2027 Outlook: Scaling the XCM Ecosystem
XCM remains one of Polkadot’s strongest structural advantages. The official XCM documentation describes it as a language and format for communication between consensus systems, not just between blockchains. That distinction matters because Polkadot has always aimed for more than simple token bridges.
If 2027 becomes the year XCM-based applications feel normal rather than experimental, DOT’s valuation can improve without needing meme momentum. Our 2027 working range is $2.50 to $8.50, with a base case near $4.80. That would still leave DOT far below its old high, but it would mark a meaningful repricing of Polkadot’s actual utility layer.
2028 DOT Prediction: Post-Bitcoin Halving
By 2028, the question becomes whether Polkadot has moved beyond infrastructure talk into product adoption. If the Web3 Foundation and ecosystem builders successfully turn Asset Hub, XCM, Coretime, and JAM-era tooling into sticky apps, DOT can re-rate. If not, it remains a technically elegant network with mediocre investor attention.
Our 2028 range is $4.00 to $12.50, with a base case around $7.20. That is where a more constructive Polkadot price forecast becomes plausible: not because DOT suddenly becomes the fastest chain, but because its economic model starts matching actual network demand.
2029 DOT Vision: Polkadot as the Multi-Chain Settlement Layer
This is the year where the institutional version of the DOT thesis could become visible. Parity’s March 2026 update introduces a StakingOperator proxy for service providers that run validators on behalf of institutional stakers in a non-custodial way. That is not a spot ETF headline, but it is real infrastructure for larger capital pools.
If Polkadot also keeps migrating activity to Asset Hub and system chains, while gaming ecosystems like Mythos continue building on its shared-security stack, 2029 could be the first time Polkadot feels less like a “crypto architecture bet” and more like a multi-chain settlement network. Our 2029 mental range is $5.50 to $18.00.
Polkadot Price Prediction 2030–2035
Can DOT Reach $100? Analyzing Market Cap Scenarios vs. Ethereum
This is the high-volume question behind every aggressive Polkadot price prediction 2030 search. With roughly 1.67 billion DOT circulating today, a $100 DOT price would imply a market cap around $167 billion, and that ignores additional supply toward the cap over time. With a full 2.1 billion token cap, $100 implies $210 billion.
That is not mathematically impossible. But it would require Polkadot to become one of crypto’s largest infrastructure layers by a wide margin. In other words, $100 is a heroic bull case, not a base case. Our 2030 base range is $7 to $28, with the upper edge requiring both strong product adoption and a much friendlier macro environment for alt-L1 and interoperability assets.
Polkadot Governance (OpenGov)
OpenGov is still one of Polkadot’s underappreciated differentiators. Official docs explain that OpenGov uses origins and tracks to determine authority and voting flow, while the 2025-Q4 treasury report shows Polkadot’s DAO managing tens of millions of dollars worth of assets and, for the first time since OpenGov’s introduction, posting a positive income statement for the quarter.
That treasury report is more important than it looks. It shows the network is not just issuing DOT and hoping for the best. It is increasingly treating treasury management like a serious balance-sheet function, including stablecoin reserves, DeFi deployments, and ecosystem allocations. That gives long-term Polkadot outlook models a stronger foundation than pure speculation.
2035 Long-Term Forecast: DOT’s Role in a Web3 World
If the long-term vision works, Polkadot in 2035 is not “the Relay Chain with parachains.” It is a multi-layer, system-chain, compute-market, messaging-rich environment where sovereignty and shared security coexist. JAM would matter enormously in that future, because it extends Polkadot’s core design into a broader computational model.
That is why our 2035 range is $12 to $45. This is not predicting moon math. It is the acknowledgement that a fully delivered Polkadot roadmap would justify much higher valuations than a half-finished one, but still needs actual market share to earn them.
Our 2026 range for Polkadot price prediction is:
| Year | Min | Avg | Max |
| 2026 | $1.20 | $2.80 | $5.50 |
| 2027 | $2.50 | $4.80 | $8.50 |
| 2028 | $4.00 | $7.20 | $12.50 |
| 2030 | $7.00 | $14.00 | $28.00 |
| 2035 | $12.00 | $24.00 | $45.00 |
These are scenario ranges, not promises. They reflect current pricing, the March 2026 monetary reset, still-modest ecosystem value locked, and the possibility that Polkadot finally earns a higher multiple if 2.0 features turn into real usage.
What Actually Moves the Price of DOT?
The “Burn” Mechanism: How Coretime Revenue Destroys DOT Supply
This needs precision because the story changed over time. The older Polkadot 2.0 thesis centered on coretime sale burns, and Polkadot Wiki materials still describe coretime sales as burned, adding deflationary pressure. An approved Polkadot Fellowship RFC also explicitly framed the benefits of burning coretime revenue. But in the March 2026 DAP overhaul, Polkadot shifts to a model where transaction fees, coretime sales, and slashes go into DAP while treasury burns stop.
So what actually moves DOT now is not “burns alone,” but the balance between lower issuance, capped supply, staking demand, and protocol revenue capture. That is more complex than older articles imply, but it is also more realistic.
Real-World Assets on Polkadot: The Asset Hub Momentum
Asset Hub matters because it is becoming the practical center of user activity on Polkadot. Official support docs say balances, staking, and governance were migrated from the Relay Chain to Asset Hub, while Polkadot Hub asset docs describe it as the system parachain for issuing and managing on-chain assets, including minting, burning, transfers, and metadata.
That gives Polkadot a clearer base layer for real-world assets and institutional-grade token issuance. Whether RWAs become a major DOT catalyst depends on product adoption, but the underlying infrastructure is far more mature than it was even a year ago.
Polkadot vs. Ethereum L2s: Why Sovereignty Matters in 2026
Ethereum L2s dominate current liquidity and mindshare. But Polkadot still offers something different: application sovereignty with shared security and a native cross-consensus messaging framework. For some teams, especially gaming and enterprise builders, that matters more than plugging into yet another rollup stack.
This is why a serious Polkadot forecast cannot be reduced to “Can it beat Base or Arbitrum on TVL?” That is the wrong scoreboard. The better scoreboard is whether builders who need sovereignty, custom runtime logic, and composable security keep choosing Polkadot over more fashionable alternatives.
The Competitive Landscape
Polkadot vs. Cosmos (ATOM): Shared Security vs. Sovereignty
Cosmos has long marketed sovereignty. Polkadot’s answer has been shared security plus interoperability. The practical difference is that Polkadot lets chains remain application-specific while still benefiting from a common security and messaging framework. That is a cleaner story for enterprises that do not want to bootstrap their own validator economy from scratch.
Polkadot vs. Avalanche (AVAX): Subnets vs. Parachains/Coretime
Avalanche subnets and Polkadot parachains/coretime solve similar customer problems in different ways. Avalanche offers app-specific environments under its own architecture. Polkadot increasingly offers app-specific chains with on-demand or bulk security access, plus XCM-native communication. The arrival of Agile Coretime makes the comparison more competitive than it used to be because Polkadot now feels less capital-intensive to launch on.
Polkadot vs. Solana: Decentralized Scaling vs. Monolithic Speed
Solana wins plenty of retail mindshare because it is fast, liquid, and culturally loud. Polkadot’s counter-argument is that decentralized scaling, shared security, and modular sovereignty are better long-term bets than pushing everything into one monolithic execution environment. With Asynchronous Backing and Elastic Scaling live, Polkadot at least has a stronger technical response than it did in prior cycles.
Tokenomics Deep Dive
Understanding Inflation
The old inflation model is no longer the right framework. Parity’s March 2026 update says the supply is capped at 2.1 billion, early emissions are reduced by 53.6%, and thereafter the protocol issues 13.14% of the remaining supply every two years until the cap is reached. That is a profound shift from the open-ended inflation assumptions many older DOT models used.
The new question is not “Is DOT inflationary?” but “How fast does net issuance fall relative to staking demand and protocol revenue?” That is a much better lens for a modern Polkadot crypto price prediction.
The Polkadot Treasury: Funding Innovation Without Diluting Holders
The treasury remains an unusually important feature of Polkadot. The Q4 2025 treasury report showed approximately 32 million DOT / $57.8 million in treasury balance-sheet value at year-end, with treasury operations spreading into stablecoins, DeFi liquidity, and ecosystem assets such as MYTH. That means DOT holders are not just exposed to one token; they are indirectly exposed to a governance machine that allocates capital across the network.
That can be powerful when governance is disciplined and destructive when it is not. So treasury quality is a real price driver, not a side note.
Governance Participation: How Voting Power Drives Ecosystem Loyalty
OpenGov creates a stickier community than price-only speculation does. Users who stake, join nomination pools, or participate in governance are more likely to remain engaged through downcycles. Polkadot’s nomination pools even let users participate with as little as 1 DOT, which lowers the barrier to staking and governance-linked loyalty.
Staking rate vs. Coretime burn
Because public long-range burn data is fragmented and the March 2026 DAP reform changes how revenue is routed, the most honest way to visualize this is as a trend summary rather than a fake precision chart.
| Period | Staking rate / reward backdrop | Coretime / revenue-capture backdrop | What it meant for DOT |
| 2024 | High inflation mindset, auctions fading | Coretime-burn thesis emerges | Market starts repricing DOT’s utility story |
| 2025 | ~50%+ supply staked | Coretime revenue grows sharply; Parity data shows 11.0x revenue growth from 2024 to 2025 | Investors begin treating DOT as a blockspace asset, not just a staking coin |
| March 2026 onward | ~51%–53% staked; nominal yields around 11.5% | DAP launches, treasury burns stop, fees/coretime/slashes flow into DAP, emissions drop 53.6% | DOT’s economics become more scarcity-driven but also more governance-dependent |
Parity’s public data summary reports 11.0x Coretime revenue growth from 2024 to 2025, while current staking and issuance data come from Polkadot’s platform materials, Staking Rewards, and Parity’s March 2026 economic update.
Is Polkadot (DOT) a Good Investment in 2026?
The Bull Case: Technical Superiority and the Institutional “Agile” Pivot
The bull case for DOT crypto price prediction models is stronger than many people think. Polkadot now has a more flexible resource market, materially better throughput, dynamic scaling, institutional staking infrastructure, a functioning treasury, and real gaming migration evidence. Mythical Games’ move from Ethereum to Polkadot and the Mythos “superchain” strategy remain among the clearest proofs that Polkadot’s architecture solves real business problems.
The Bear Case: Complexity Barriers and Marketing Challenges
The bear case is equally real. Polkadot is still complex to explain, still weaker than faster-moving competitors on retail mindshare, and still priced like a network that has not yet proven product-market fit at the scale bulls want. Great architecture does not guarantee great token performance.
How to Safely Stake and Store DOT
For long-term holders, native staking remains one of the more attractive parts of the DOT story. Polkadot’s staking dashboard and nomination pools are the cleanest non-custodial path, and official materials say users can join pools with as little as 1 DOT. The trade-off is that staking still involves protocol risk, validator-selection risk, and changing economics as the March 2026 reforms roll out. Learn How Does Staking Works.
Where to Buy and Exchange Polkadot
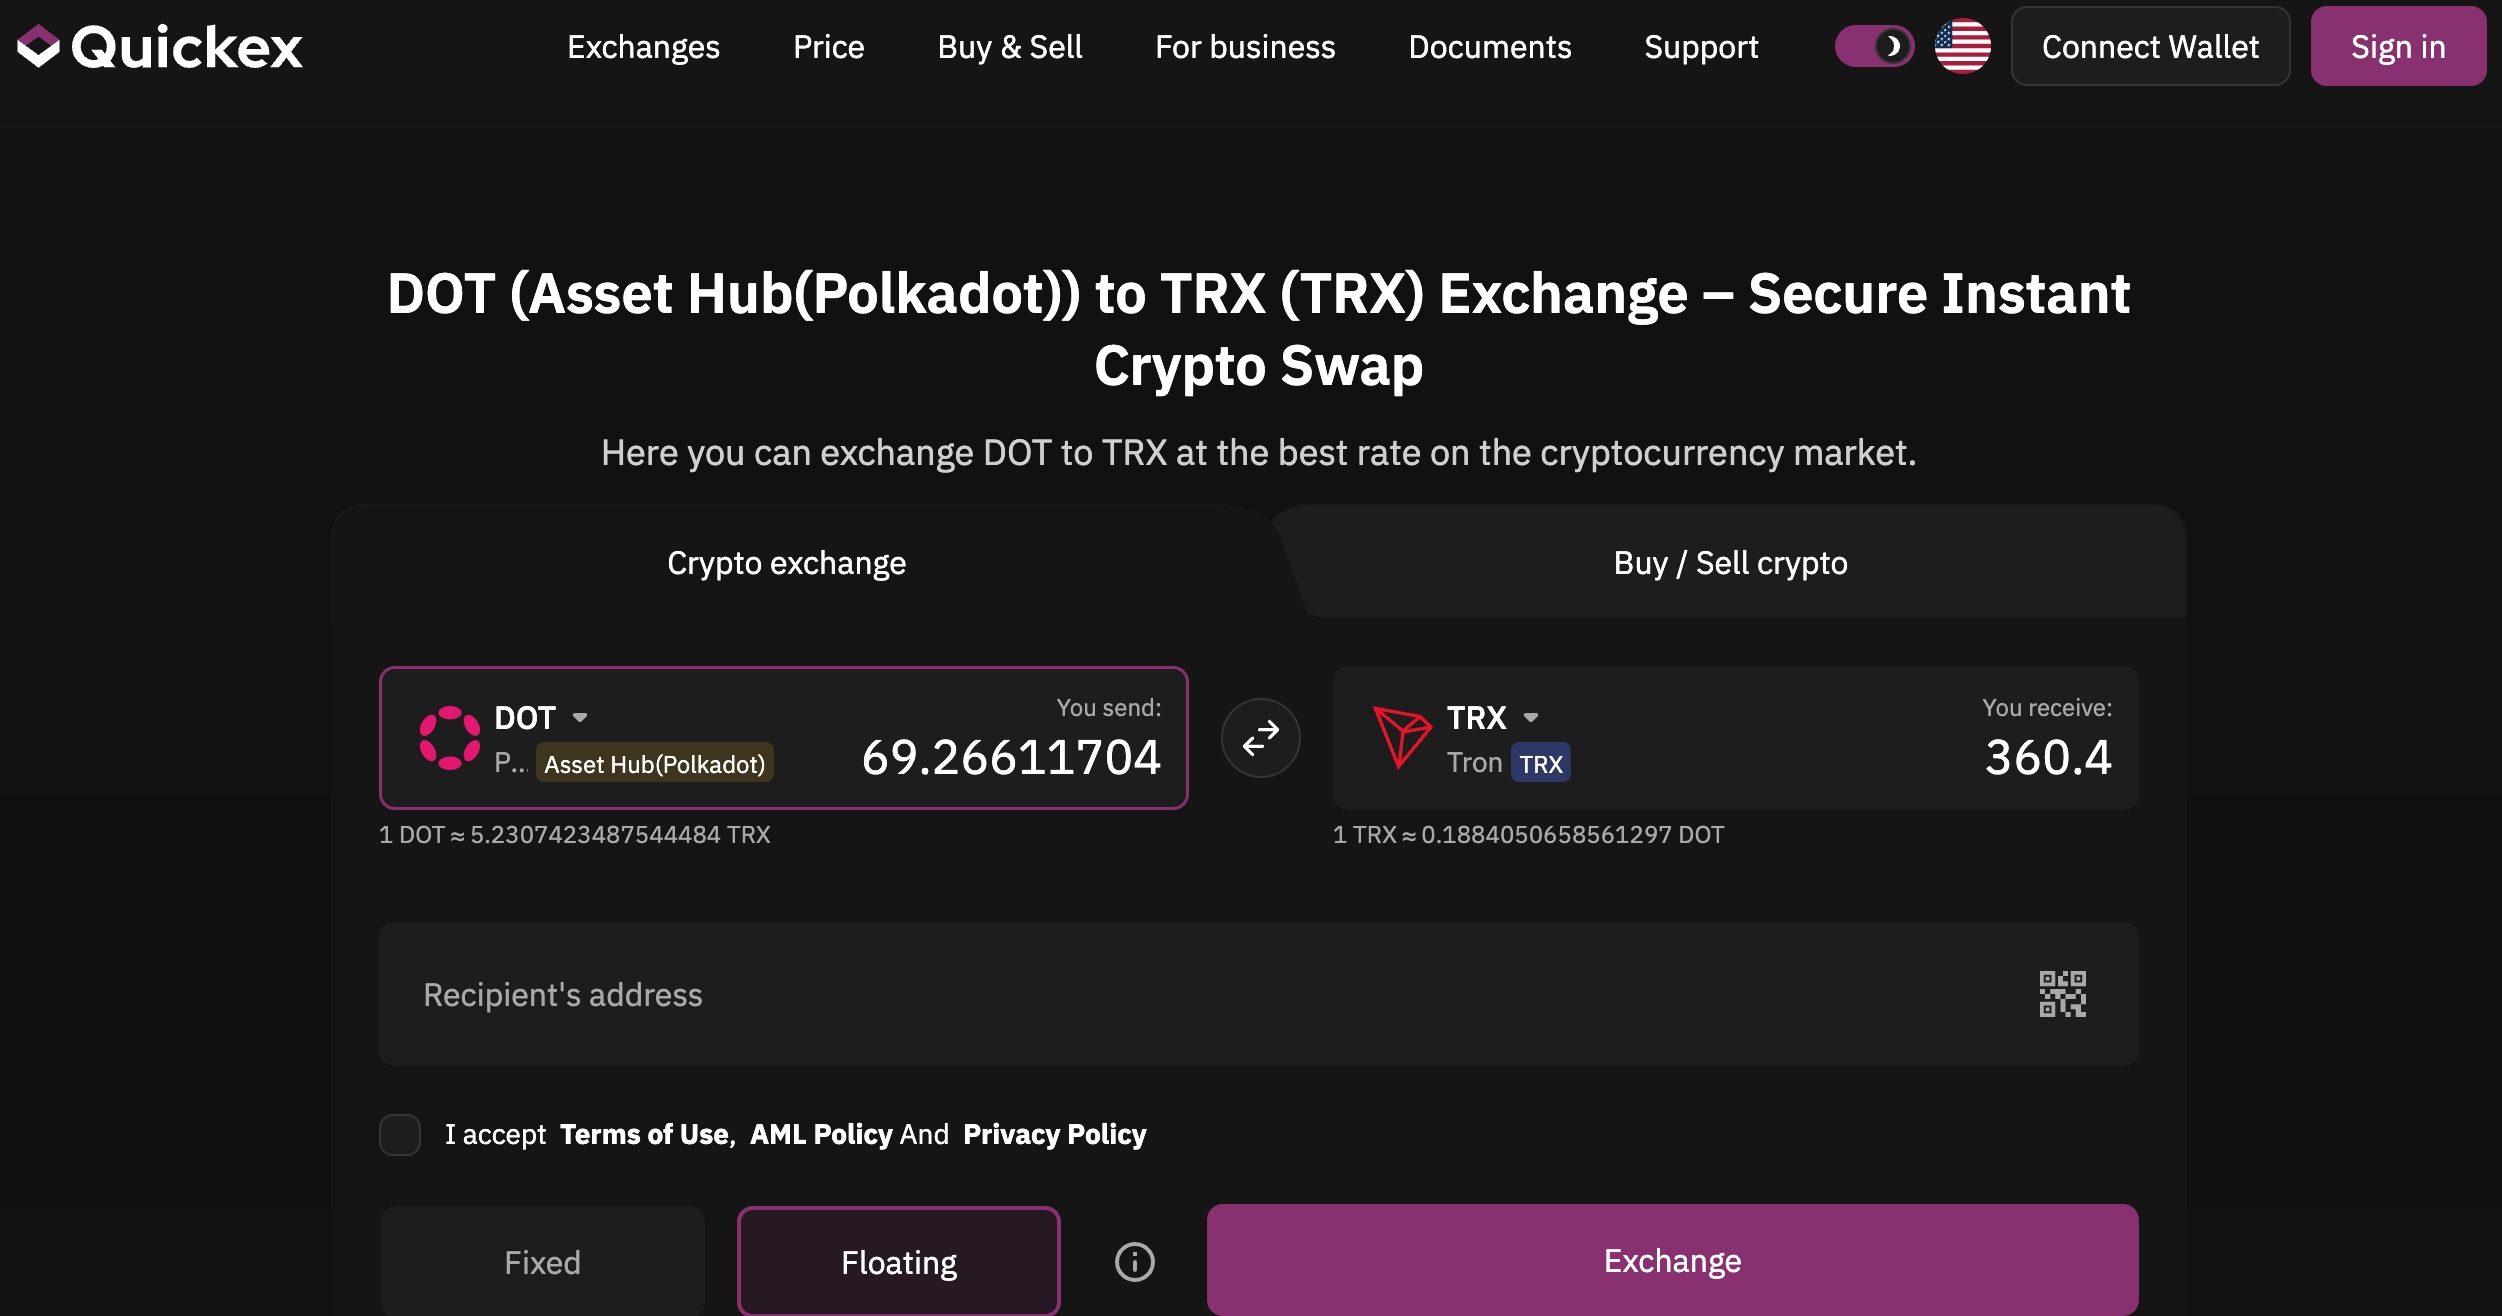
If you want to swap DOT to TRX quickly, Quickex is one example of a centralized exchange flow where you choose a pair, enter the destination wallet, send the source asset, and receive DOT after confirmations. That said, rate comparison and address verification still matter more than convenience. Always double-check the destination chain and do a small test transaction if you are moving size.
FAQ: Polkadot (DOT) Price Prediction
What is the current Polkadot price?
The current Polkadot price trades in the $4.50 – $5.50 USD range as of mid-2026 — a dramatic decline from its all-time high of $55.00 reached in November 2021.
- Current DOT price: ~$4.50 – $5.50 USD
- All-time high: $55.00 (November 2021)
- Distance from ATH: ~90% below peak
- Market cap: ~$7 – $8.5 billion USD
- Circulating supply: ~1.55 billion DOT — Polkadot has an inflationary token model with no fixed hard cap; annual inflation is approximately 7–10%, partially offset by staking rewards and treasury burns
- Staking yield: ~14–18% APY on natively staked DOT — one of the highest PoS staking returns among top-20 cryptocurrencies
- Rank: Consistently top 15–20 by market cap
Polkadot ecosystem: TVL, developer activity, and parachains in 2026
Any serious DOT price prediction must account for the state of the Polkadot ecosystem — a complex multi-chain architecture that has undergone significant changes since 2024.
- TVL: Polkadot ecosystem DeFi TVL sits at approximately $150 – $250 million as of mid-2026 — modest compared to Ethereum ($50B+), Solana ($5B+), or even Sui ($400M+). Hydration (formerly HydraDX), Acala, and Moonbeam contribute the largest share.
- Parachains → Coretime: Polkadot transitioned from slot auctions (expensive, 2-year lease model) to Agile Coretime in 2024 — a flexible, on-demand blockspace purchasing system. This reduced the barrier for new projects but also eliminated the forced DOT lockup mechanism that supported price during auctions.
- Active parachains: ~50+ parachains operational in 2026 — key projects include Moonbeam (EVM compatibility), Acala (DeFi hub), Astar (smart contracts), Phala (privacy), and Centrifuge (RWA tokenisation).
- Developer activity: Polkadot maintains a strong developer community according to Electric Capital data, ranking in the top 5–8 ecosystems by full-time developers. The Substrate/Rust development framework remains one of the most sophisticated blockchain SDKs available.
- Polkadot 2.0: The “Polkadot 2.0” roadmap includes Agile Coretime, asynchronous backing (improved throughput), and elastic scaling — all designed to make Polkadot more competitive as a scalable multi-chain platform.
- JAM Protocol: Announced by Gavin Wood in 2024, JAM (Join-Accumulate Machine) is a proposed overhaul of Polkadot’s Relay Chain architecture — potentially the biggest upgrade since mainnet launch. Still in development as of mid-2026.
- Ecosystem concern: Despite strong technology, Polkadot’s TVL growth has lagged behind competitors. The 2024 OpenGov controversy (large treasury spends on marketing with questionable ROI) eroded community trust and triggered governance reform discussions.
Polkadot price prediction: pessimistic, base, and optimistic scenarios
Here’s a full scenario-based Polkadot price prediction across three key time horizons, aggregated from multiple analyst models:
| Horizon | Pessimistic | Base | Optimistic |
|---|---|---|---|
| 2026 | $3.00 – $4.50 | $5.50 – $10.00 | $12.00 – $18.00 |
| 2027 | $3.50 – $5.00 | $8.00 – $15.00 | $18.00 – $30.00 |
| 2030 | $4.00 – $8.00 | $15.00 – $35.00 | $40.00 – $75.00 |
DOT price prediction 2026–2027: what to expect?
The DOT price prediction for 2026–2027 is shaped by several converging catalysts specific to this period:
- Polkadot 2.0 delivery window: Agile Coretime is live; asynchronous backing and elastic scaling are rolling out through 2026. JAM Protocol development is the key unknown — successful delivery would be a major re rating event for DOT.
- Governance maturation: After the 2024 treasury spending controversy, OpenGov reforms are tightening oversight on DOT treasury expenditures — potentially restoring community trust and attracting cautious institutional capital.
- Cross-chain bridges: Polkadot’s XCM (Cross-Consensus Messaging) and Snowbridge (Ethereum ↔ Polkadot bridge) enable trustless interoperability — a key technical advantage if multi-chain DeFi gains traction.
- Staking supply lock: With ~55–60% of all DOT staked (~14–18% APY), less circulating supply is available for selling — a structural support for price during moderate market recoveries.
- Bitcoin cycle alignment: 2026–2027 falls within the post-halving window historically associated with altcoin rallies. If BTC breaks new ATH territory, DOT typically outperforms with a 2–5× multiplier versus Bitcoin.
- 2026–2027 targets:
- Pessimistic: $3.00 – $5.00
- Base: $5.50 – $15.00
- Optimistic: $12.00 – $30.00
Is Polkadot (DOT) a good investment? Risks and opportunities
Whether Polkadot is a good investment in 2026 depends on your conviction in the multi-chain thesis and your tolerance for inflationary tokenomics. Here’s a balanced investment analysis:
Bull case for DOT
- Technically superior architecture: Polkadot’s shared security model, heterogeneous sharding, and on-chain governance remain one of the most architecturally ambitious L0 designs in crypto — built by Gavin Wood (Ethereum co-founder, Solidity creator).
- Deep discount from ATH: Trading ~90% below $55.00 ATH — historically, fundamentally strong projects at 85–95% drawdowns from peak have offered the highest risk-adjusted return potential in subsequent bull cycles.
- Highest staking yield among top-20: ~14–18% APY on natively staked DOT — significantly higher than ETH (~3.5%), SOL (~7%), or ADA (~3.5%). For long-term holders, staking partially offsets inflation.
- JAM Protocol upside: If JAM successfully replaces the Relay Chain, it could dramatically improve Polkadot’s throughput and flexibility — potentially attracting developers from Ethereum and Cosmos ecosystems.
- RWA and enterprise use cases: Centrifuge (real-world asset tokenisation) and institutional parachains position DOT for enterprise blockchain adoption.
Bear case for DOT
- Inflationary tokenomics: ~7–10% annual inflation with no hard cap — unlike Bitcoin (21M), Ethereum (deflationary post-Merge), or even competitors like Cosmos. New DOT issuance dilutes holders not actively staking.
- Lagging TVL: $150–$250M DeFi TVL in 2026 — far behind Ethereum ($50B+), Solana ($5B+), Sui ($400M+), and even Avalanche ($300M+). The ecosystem has not achieved the DeFi adoption its technology enables.
- Complexity barrier: Polkadot’s architecture (Relay Chain, parachains, XCM, Coretime) is significantly more complex than competitors for both developers and end-users — limiting onboarding speed.
- Treasury governance controversy: The 2024 OpenGov treasury spending scandal (millions of DOT spent on questionable marketing) damaged community trust and highlighted governance risks in fully on-chain systems.
- Competitive pressure: Cosmos (IBC), Ethereum L2s (Arbitrum, Base), and Solana are capturing the cross-chain and modular blockchain narratives that Polkadot pioneered — often with simpler developer UX.
Polkadot market cap, tokenomics, and DOT supply dynamics
Understanding Polkadot’s market cap and tokenomics is essential for evaluating DOT’s long-term price ceiling — especially given its unique inflationary model.
Market cap & supply
- Current market cap: ~$7 – $8.5 billion USD (top 15–20 globally)
- Circulating supply: ~1.55 billion DOT
- Total supply: No fixed hard cap — DOT has an inflationary model with ~7–10% annual new issuance
- Staked DOT: ~55–60% of all circulating DOT is staked — reducing effective liquid supply by more than half
- Treasury balance: The Polkadot Treasury holds tens of millions of DOT — governed by on-chain OpenGov proposals. Spending rate has been a source of community debate.
Supply dynamics: inflation vs. demand sinks
| Factor | Effect on Supply | Impact on Price |
|---|---|---|
| Annual inflation (~7–10%) | 📈 Increases circulating supply | 🔴 Bearish — dilutes non-staking holders |
| Staking rewards (~14–18% APY) | 📉 Locks ~55–60% of supply | 🟢 Bullish — reduces liquid sell pressure |
| Coretime purchases | 📉 DOT spent on blockspace is burned or sent to treasury | 🟢 Bullish — creates demand-based DOT sink |
| Treasury spending | 📈 DOT distributed to projects and marketing | 🔴 Bearish — if sold by recipients on open market |
| Slashing events | 📉 Burned from validator misbehaviour | 🟢 Bullish — removes supply permanently |
⚠️ Disclaimer — Not Financial Advice. All Polkadot (DOT) price predictions presented in this article are for informational and educational purposes onlyand do not constitute financial, investment, or trading advice. Cryptocurrency markets are highly volatile; past performance is not indicative of future results. Any investment in DOT or any other digital asset carries significant risk, including the potential loss of your entire principal. Polkadot’s inflationary tokenomics mean that non-staked holdings are diluted annually. Always conduct your own research (DYOR), consult an independent financial advisor, and never invest more than you can afford to lose. QuickEx does not endorse any specific price forecast or investment outcome.
Disclaimer: The material in this article is not financial or investment advice. Everything stated here reflects the author's personal view and should not be treated as a recommendation to trade or invest. We make no warranties regarding the accuracy, reliability or completeness of the information presented. Cryptocurrency markets are highly volatile and can move unpredictably. Before committing any funds, every investor, trader or crypto user should study several independent sources and check the regulations that apply in their own jurisdiction.